blog

Common pesticides stop bees and flies from getting a good night’s sleep

Just like us, many insects need a decent night’s sleep to function properly, but this might not be possible if they have been exposed to neonicotinoid insecticides, the most common form of insecticide used worldwide, suggests research by academics at the University of Bristol.

Two studies by scientists at Bristol’s Schools of Physiology, Pharmacology and Neuroscience and Biological Sciences have shown these insecticides affect the amount of sleep taken by both bumblebees and fruit flies, which may help us understand why insect pollinators are vanishing from the wild.

Dr Kiah Tasman, Teaching Associate in the School of Physiology, Pharmacology and Neuroscience and lead author of the studies, said: “The neonicotinoids we tested had a big effect on the amount of sleep taken by both flies and bees. If an insect was exposed to a similar amount as it might experience on a farm where the pesticide had been applied, it slept less, and its daily behavioural rhythms were knocked out of synch with the normal 24-hour cycle of day and night.”

The fruit fly study published today [21 January] in Scientific Reports, allowed the researchers to study the impact of the pesticides on the insect brain.

As well as finding that typical agricultural concentrations of neonicotinoids ruined the flies’ ability to remember, the researchers also saw changes in the clock in the fly brain which controls its 24-hour cycle of day and night.

Dr James Hodge, Associate Professor in Neuroscience in the School of Physiology, Pharmacology and Neuroscience and senior author for the study, added: “Being able to tell time is important for knowing when to be awake and forage, and it looked like these drugged insects were unable to sleep. We know quality sleep is important for insects, just as it is for humans, for their health and forming lasting memories.”

Dr Sean Rands, Senior Lecturer in the School of Biological Sciences and co-author, explained: “Bees and flies have similar structures in their brains, and this suggests one reason why these drugs are so bad for bees is they stop the bees from sleeping properly and then being able to learn where food is in their environment.

“Neonicotinoids are currently banned in the EU, and we hope that this continues in the UK as we leave EU legislation.”

(adapted from University of Bristol press release, published 21st January 2021)

further reading

Tasman K, Rands SA & Hodge JJL (2020). The neonicotinoid insecticide imidacloprid disrupts bumblebee circadian rhythms and sleep. iScience 23: 101827 doi: full text (open access) | pdf (open access)

Tasman K, Hidalgo S, Zhu B, Rands SA & Hodge JJL (2021). Neonicotinoids disrupt memory, circadian behaviour and sleep. Scientific Reports11: 2061 | full text (open access) | pdf
Bees use invisible heat patterns to choose flowers

beeIn the hidden world of flower-pollinator interactions, heat can act not only as life-sustaining warmth, but can also be part of the rich variety of sensory signposts that flowers use to provide advertisement and information for their insect pollinators.

The majority of flowers examined, including many common in gardens, such as poppies and daisies, had complex patterns of heat across their petals, echoing the colourful patterns that we see with our own eyes.

On average these patterns were 4–5°C warmer than the rest of the flower, although the patterns could be as much as 11°C warmer.

We made artificial flowers that copied these heat patterns, but did not include the corresponding colour patterns.

While these artificial flowers look identical to human eyes, and we are not able to tell them apart, it is a different case for foraging bumblebees.

Bumblebees, who visit a wide range of different flowers, were found to be able to use these patterns to distinguish between different flowers and the rewards that they provide.

The study’s lead author, Dr Heather Whitney, from the University of Bristol’s School of Biological Sciences, said: “The presence of multiple cues on flowers is known to enhance the ability of bees to forage efficiently, so maximising the amount of food they can take back to sustain the rest of their colony.

“Climate change might have additional previously unexpected impacts on bee-flower interactions by disrupting these hidden heat patterns.”

The lead author of this publication, Mike Harrap, is a NERC-funded PhD student based at the University of Bristol. Heather Whitney was funded by the European Research Council.

(edited version of University of Bristol press release)

FURTHER READING

Harrap MJM, Rands SA, Hempel de Ibarra N & Whitney HM (2017). The diversity of floral temperature patterns, and their use by pollinators. eLife 6: e31262 | full text (open access) | dryad dataset | accompanying insight article by Bing & Kessler

arom’in around the flowers: how bees cope with a smelly environment

beeguest blog by David Lawson

Sensory overload happens to us all. Whether you’re in the centre of town or waiting for a train at a station, sometimes you’re bombarded by a cacophony of noises, images and even smells. Your mind can only do so much to sort out what’s relevant to you or what’s worth ignoring. People talking, music booming, buses passing, announcements blaring out into the air. You hear a phone ring and assume it’s someone else’s, but then you notice the vibrating of the phone in your pocket and know it’s yours. By matching up the ringing of the phone with the vibration, you’re certain that this information is relevant to you.

The environment of a foraging bee can be equally noisy, but not just with sound. These complex floral marketplaces are filled with the smells and colours of various flowers, some of which are more rewarding than others, but just like us and our phones, bees have a similar techniques to find the relevant flowers. In our recent publication in Royal Society Open Science, we have looked into the ways in which bumblebees find flowers while looking for nectar. Using artificial flowers, we recorded how quickly the bees can learn the difference between scented flowers when exposed to environments filled with different scents. We discovered that bees could differentiate between the flowers much faster when the flowers had visual aspects along with their scents.

These findings suggest that the visual aspects of flowers could be used as a backup for the scent of flowers when scent is compromised, ensuring that bees can find the most rewarding flowers in uncertain environments. This helps us understand how bees, and the pollination services they provide, might be affected in a rapidly changing world.

Further reading

Lawson DA, Whitney HM & Rands SA (2017). Colour as a backup for scent in the presence of olfactory noise: testing the efficacy backup hypothesis using bumblebees (Bombus terrestris). Royal Society Open Science 4: 170996 | full text (freely readable open access) | pdf

Bumblebees can tell each other apart using scent marks

We have discovered that bumblebees have the ability to use ‘smelly footprints’ to make the distinction between their own scent, the scent of a relative and the scent of a stranger.

beeBumblebees have the ability to use ‘smelly footprints’ to make the distinction between their own scent, the scent of a relative and the scent of a stranger. By using this ability, bees can improve their success at finding good sources of food and avoid flowers that have already been visited and mined of nutrients by recognising who has been there previously. A study conducted as part of Richard Pearce‘s PhD that shows this has been published in Scientific Reports today.

Bumblebees secrete a substance whenever they touch their feet to a surface, much like us leaving fingerprints on whatever we touch. Marks of this invisible substance can be detected by themselves and other bumblebees, and are referred to as scent marks.

We performed three separate experiments with bumblebees, where they were repeatedly exposed to rewarding and unrewarding flowers simultaneously that had footprints from different bees attached to them.

Each flower type either carried scent-marks from bumblebees of differing relatedness (either their own marks, sisters from their nest, or strangers from another nest), or were unmarked.

We discovered that bees were able to distinguish between these four different flower types, showing that not only can bees tell the marks of their own nest mates from strangers, but also that they can discriminate between the smell of their own footprints and those of their nest mate sisters.

This is the first time it has been shown that bumblebees can tell the difference between their scent and the scent of their family members. This ability could help them to remember which flowers they have visited recently.

Bumblebees are flexible learners and, as we have discovered, can detect whether or not it is they or a different bumblebee that has visited a flower recently. These impressive abilities allows them to be more clever in their search for food, which will help them to be more successful.

This work, published today in Scientific Reports, was funded by the EPSRC, through the Bristol Centre for Complexity Science. This blog posting is an edited version of the University of Bristol press release.

further reading

Pearce RF, Giuggioli L & Rands SA (2017). Bumblebees can discriminate between scent-marks deposited by conspecifics. Scientific Reports 7: 43872 | full text

Consensus trumps leadership and personality

sticklebacks‘Personality’ has been a big topic in behavioural ecology for well over a decade now, and work is still coming thick and fast showing that individual animals can show consistent sets of correlated behaviours in different situations, and that that different individuals can show different sets of these behaviours.  For example, many different species have been shown to have some individuals who are ‘bold’ risk-takers who are active in their response to stimuli, whilst other ‘shy’ individuals are less likely to take risks, and will be passive in their response.
However, when groups of individuals come together to behave in a social setting, it could be the case that these consistent personalities break down, as it may not be possible or suitable for every individual to follow their own personality-defined behaviour.  A recent paper in Science Advances from Christos Ioannou’s group (McDonald et al. 2016), that I was privileged to be involved with, demonstrates just this. The study looked at what happens when you put together groups of sticklebacks that have different personalities.

By testing the fish individually, we showed that there was consistency in how they emerged from a safe shelter and travelled through a ‘dangerous’ exposed area of water in order to reach a foraging site: some individuals were bolder than others.  However, when you put groups together with a range of bold and shy individuals, the shy individuals tended to lose their shyness and behave in a similar way to the bold individuals.  This effect is only temporary – once the fish became used to the test conditions and their groups, they reverted to their initial personality-defined behaviours.

This study suggests that personality isn’t necessarily consistent in individuals, and may well depend upon context. Being able to remain in a group is very likely to be important for sticklebacks, and it makes sense that shy individuals will mask their behaviour in order to maintain the protection of a group.  Whether this is ignoring the behaviour determined by their own personality, or rather another aspect of their personality that is defined by social context or some other aspect of state (see Dall et al. 2004 for discussion), it suggests that there is a lot more to be explored concerning how personalities are affected by groups.

further reading

Dall SRX, Houston AI & McNamara JM (2004). The behavioural ecology of personality: consistent individual differences from an adaptive perspective. Ecology Letters 7: 734-739 | abstract

McDonald ND, Rands SA, Hill F, Elder C & Ioannou CC (2016). Consensus and experience trump leadership, suppressing individual personality during social foraging. Science Advances 2: e1600892 | full text (open access) | pdf | blog posting from Christos Ioannou

normal service will (probably) be resumed shortly…

Test Card FOkay, maybe a few weeks until the next scientific post. This term (not quite finished) has been killer hard, and exhausting – twelve week teaching blocks without any gaps in them seem to be quite hard for the students, as well as us doing the teaching. Personally, I have about a week more of administration and marking, and some final year MSci project student talks and posters to look forward to, and then I should be mentally free to get back to some bits of research that I’m itching continue with.

Standard moaning aside, there is much to be happy about at the moment. Richard Pearce and David Lawson are deep into writing their dissertations, and both have papers I am very keen for the world to see at various stages of the review process. Ongoing shared students are also coming along nicely, and I hope to be able to say something good about several of them soon (and show off my Lego skills)!

I should be posting shortly about a paper I was happily involved with, looking at how personality and leadership decisions can be influenced by what the rest of your social group are doing.  If you’re curious about this, have a look at what Christos Ioannou says about it. There will also be another post thinking about something new and exciting we can do with bird feeder experiments, tying in with a paper I have coming out in Royal Society Open Science at some point in the next month…


Further reading

McDonald ND, Rands SA, Hill F, Elder C & Ioannou CC (2016). Consensus and experience trump leadership, suppressing individual personality during social foraging. Science Advances 2: e1600892 | full text (open access) | pdf

normal service will be resumed shortly…

Test Card FThat last blog post from over a year ago was a classic false start – it’s been a hard year for both personal and non-personal reasons (and the referendum decision by the British public to leave the European Union still weighs heavily – sigh), but the start of the academic year and some nice work in progress/review has spurred me back into action. There are a number of posts in progress at the moment, not least one looking at the recent paper by McDonald et al. in Science Advances that I am very pleased to have been involved with. More over the next few days…

more soon…

I’m currently on leave until mid-July, and have been taking extended paternity leave since January to look after a little person. It’s both great fun and very hard work, and I currently don’t intend to devote any time to these pages until I get back. However, there is a back-log of half-finished blog posts that need polishing, and that will hopefully start trickling out once I am back to work and have handled all the administrative tasks that wait for me. You have been warned!

Seasonal variation of ‘cresty neck’ in horses

guest blog by Sarah Giles

‘Cresty neck’ in horses is an abnormally large amount of nuchal neck crest fat, fat along the top of the neck. It can be seen as akin to abdominal adiposity in humans, this region specific adiposity can cause a range of metabolic disorders in both species. In horses, this metabolic changes have been associated with laminitis, a debilitating condition affecting the hoof which can cause debilitating and sometimes fatal lameness. Our paper, recently published in BMC Veterinary Research explores seasonal differences in neck crest adiposity in groups of domestic horses and ponies.

http://www.biomedcentral.com/1746-6148/11/13/figure/F1

It is not yet known why neck crest fat specifically is more strongly associated with metabolic abnormalities, but our study has presented some unusual results which might warrant investigation. Our previous study highlighted the seasonal variation in body condition and obesity present in outdoor living domestic horses and ponies (see previous blog post). This second study was conducted on the same population of animals, yet crucially, showed the exact opposite pattern of seasonal variation!

Unusually, the prevalence of ‘cresty neck’ was highest at the end of winter. This is surprising, firstly because, quite obviously, there is less grass available at the end of winter for outdoor living animals. Then secondly, because it had previously been speculated, arguably quite rightly, that the role of fat stores is to aid survival during winter months when food is scarce. Why then, does cresty neck seem to be more prominent in outdoor living horses at the end of winter?

Supplementary feeding was recorded, and this did not explain the results observed. The paper therefore discusses several other possible explanations. Broadly this includes a physiological explanation, where cresty neck fat is physiologically different to fat stored elsewhere and due to a potentially different physiological role. Or alternatively, we consider whether these results are simply an anomaly with the cresty neck score itself. The score may be difficult to replicate under different conditions, or there may be something about winter conditions, such as a fluffier winter coat on the animals, or less fat elsewhere, which makes the neck crest seem more prominent.

Whatever the explanation, these results were certainly unexpected and are therefore very interesting! This paper was fun to write as it was explorative and allowed for a balanced, speculative and thought provoking discussion. Disproving a hypothesis in this case, was much more interesting than proving one.

Most of all this paper is a reminder that we really don’t know all of the answers with regards to obesity and metabolic pathways in horses. We truly hope that this paper inspires further research into these potentially unusual physiological mechanisms

Further reading

Giles SL, Nicol CJ, Rands SA & Harris PA (2015). Assessing the seasonal prevalence and risk factors for nuchal crest adiposity in domestic horses and ponies using the Cresty Neck Score. BMC Veterinary Research 11: 13 | full text | pdf

There’s additional coverage of this paper at horsetalk.co.nz

Metrics for dominance interactions 2: Fighting success, Clutton-Brock et al. (1979)

dominance_iconThis is the second in a series of blog entries exploring the metrics used for assessing dominance hierarchies: see the introductory post for the rationale behind doing this, with other metrics visible through the index page.

Clutton-Brock et al. (1979) were interested in giving a metric to fighting success in red deer stags, where individuals were studied over long periods of time. Studying any network system over longer periods of time is going to cause a problem, as the status of individuals may change during that period (see Rands 2014 for some discussion of this problem), and the authors of this paper were aware that a male’s dominance could change within a mating period as his energy levels flagged or he became injured. Simply counting the number of fights won and lost will not give a very accurate reflection of how an individual is placed within the herd, as his success is also going to depend upon the idntities of the individuals he beats: a male who consistently fights and wins against weak opponents is not necessarily going to be of similar quality to a male who consistently fights and wins against strong opponents. So, Clutton-Brock and colleagues designed a simple metric that takes account of the quality of opponents individuals win and lose against.

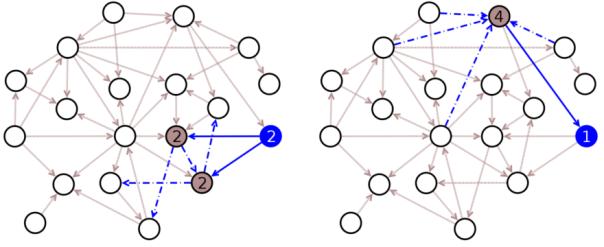
I’ll illustrate how this is calculated with by considering the fighting ability metric of two individuals (labelled black and blue) within the following group structure:

Figure 1: all winner/loser interactions recorded. As depicted in the box, the arrow denotes which individual is the winner (W) or loser (L) in a connected pair.
Figure 1: all winner/loser interactions within a group. As depicted in the box, the arrow denotes which individual is the winner W or loser L in a connected pair.

To gauge an individual animal’s fighting success, you need to calculate B, the number of other animals that the focal individual has won against, and note the identities of all the losers. For each of these marked losers, you also need to calculate the number of individuals that they in turn have beaten, and sum these to give Σb. Because we define one individual in an interacting pair as a winner, and the other a loser, this means that none of the summed interactions contributing to Σb are against the focal individual.

As well as assessing wins, you also need to calculate L, the number of other individuals that the focal loses against. These winning animals are marked and the summed number of animals that they themselves lose against is calculated, giving Σl.

Having collated these numbers, the fighting success of a focal individual (which I will refer to as DCB) is calculated as

DCB = (B + Σb + 1)/(L + Σl + 1),

where the “+1” term on both the top and bottom of the equation allows a meaningful metric to be calculated for individuals that are either never seen to win or lose.

Using the group interactions given in Figure 1, we calculate DCB for the individual coloured black using the following reasoning:

Figure 2: Calculating black's win (left panel) and loss (right panel) statistics
Figure 2: Calculating black’s win (left panel) and loss (right panel) statistics

Following Figure 2, we see that B = 8, Σb = 2 + 2 + 2 + 1 + 1 + 0 + 0 + 0 = 8, L = 3, and Σl = 2 + 2 + 0 = 4. So, DCB = (8 + 8 + 1)/(3 + 4 + 1) = 2.125 for the black individual. Similarly, using the reasoning given in Figure 3, DCB =1.167 for the blue individual.

Figure 3: Calculating blue's win (left panel) and loss (right panel) statistics
Figure 3: Calculating blue’s win (left panel) and loss (right panel) statistics

A larger value of DCB will notify a greater fighting ability, and the maximum size of the statistic within an observed group is going to depend on both the size of the group and the maximum number of other animals that each individual in the group interacts with.   In their original paper, Clutton-Brock and his colleagues found DCB for red deer ranged between 0 and a little over 3.

This is a simple statistic to compute, but I would caution that it should really only be used for comparing individuals within a group, given that it is dependent upon both group size and number of interactions recorded. The metric is also dependent upon observed relationships being fixed: an individual that wins an interaction will always win future interactions with the same opponent. This suggests that caution should be used if this metric were to be transferred to observed interactions where the dynamic between a dyad could change over time.

Further reading

Clutton-Brock TH, Albon SD, Gibson RM & Guinness FE (1979). The logical stag: adaptive aspects of fighting in red deer (Cervus elaphus L.). Animal Behaviour 27: 211-225 | pdf

Rands SA (2014). We must consider dynamic changes in behavior in social networks, and conduct manipulations: comment on Pinter-Wollman et al. Behavioral Ecology 25: 259-260 | full text | pdf

Technical Note: The network diagrams were drawn on a Mac with Dia Diagram Editor (open source freeware), and coerced into nice smooth images with GIMP (GNU Image Manipulation Program: open source freeware).